On-site computing, reference data sets, operating system support and development environs
demo & tour
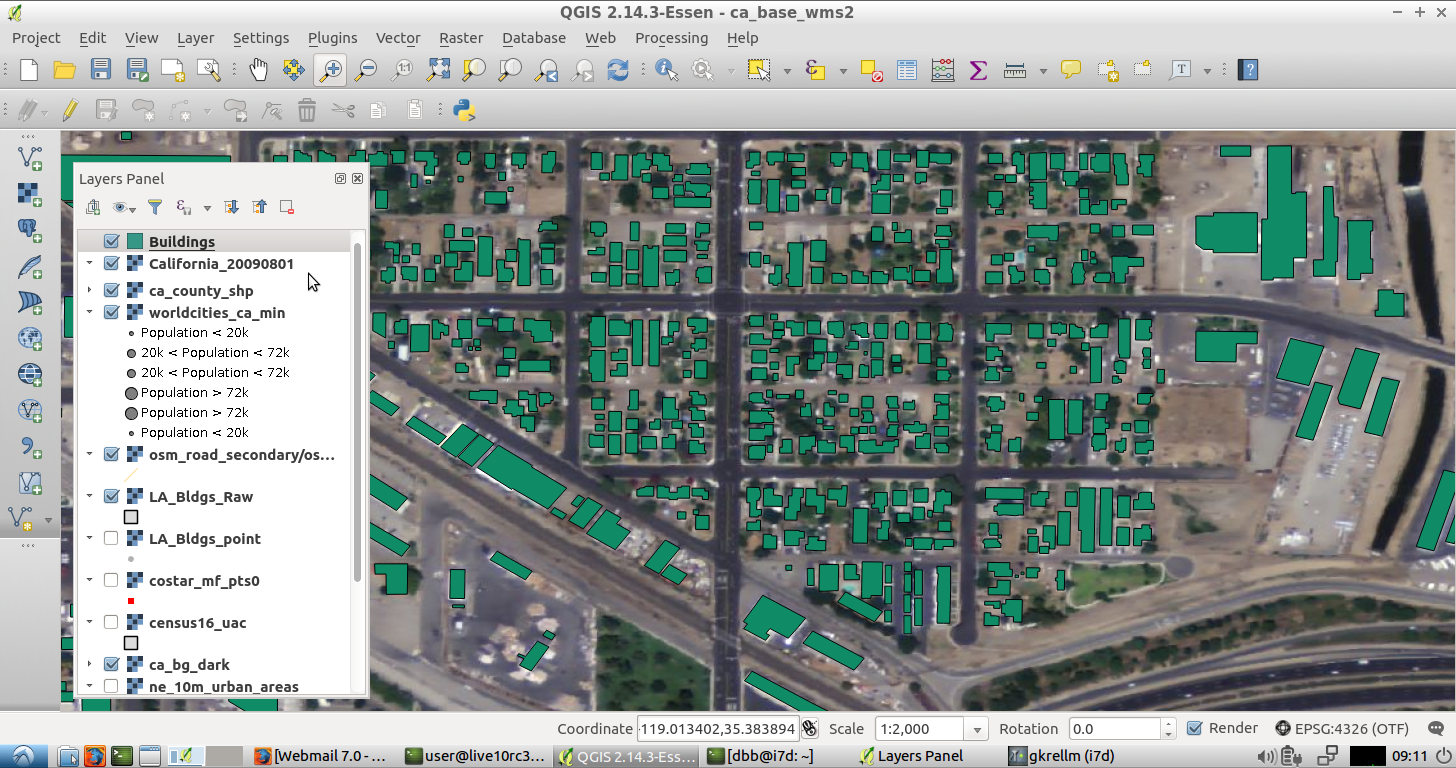
Project Overview: Collect available digital vector assets of building footprints statewide (data), QA/QC that data, and build derived products from that data, deploying project internal infrastructure as needed. see process snapshots :

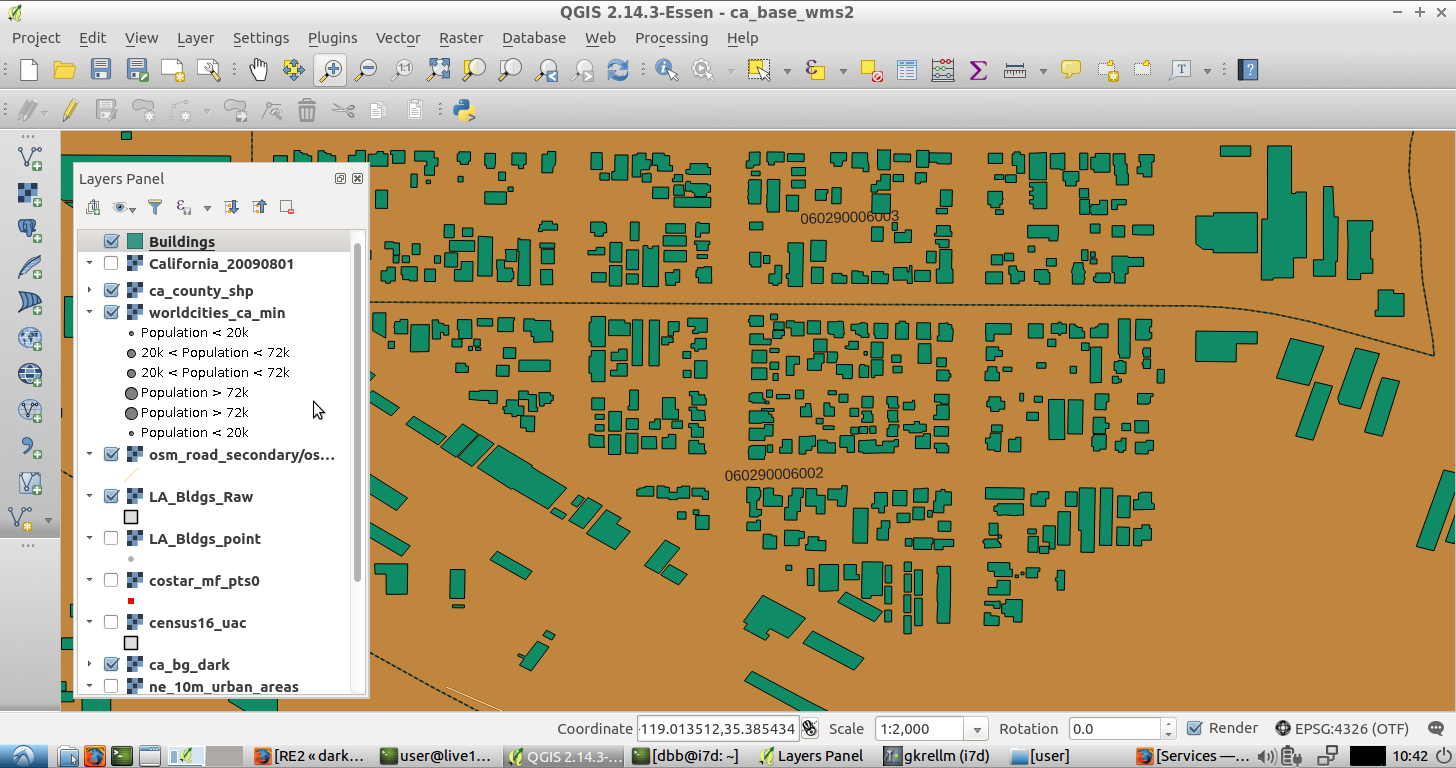
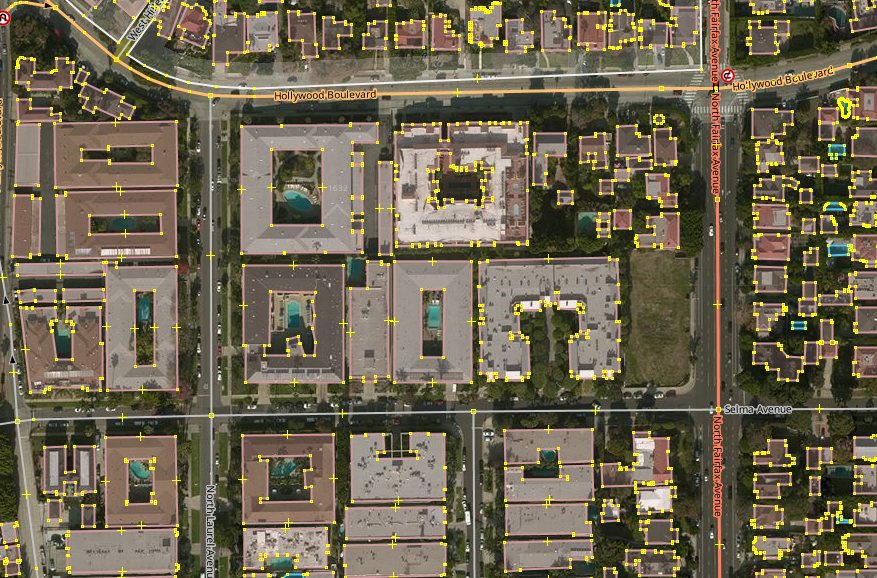
WMS Identify — LA Bldgs
- WMS Layer assets are typically viewed via Web Mapping Services. styled WMS layers are intelligently sampled on the server-side to send only necessary information across data links. Selected WMS layers also support feature identification. -wikipedia-
- Server Assets are delivered upon request by Web Services including Geoserver, in a plurality of formats and under a security framework based on Spring Security.
- Source Code Ingestion, processing and reporting are driven by code, be it SQL, python, shell script or other. Code, snippets and certain intermediate assets are stored in Git source control.
- Contents
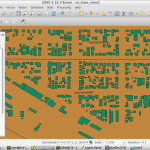
Blockgroup IDs
- Buildings — e.g. retrieved from City of Bakersfield as shapefile (SHP)
- California, other North America — NAIP imagery stored locally
- ca_county_shp — US Census TIGER reference shapefiles
- worldcities_ca_min — City name as POINT with population count and dynamic styling
- osm_roads — from Openstreetmap California data snapshot, extracted and styled for visualization (viz)
- LA_Bldgs_raw — full dataset from LA County, 1st ed. 2008
- LA_Bldgs_pt — buildings with attributes, stored as POINT for summary spatial statistics
- costar_mf_pts0 — Costar Multifamily units, supplied by CEC
- census_2016_uac — urban areas layer; US Census TIGER reference shapefiles
- ca_bg_dark — blockgroups ; US Census TIGER reference shapefiles with labeling
- ne_10m_urban_areas — NaturalEarth dataset; simplified urban area boundaries
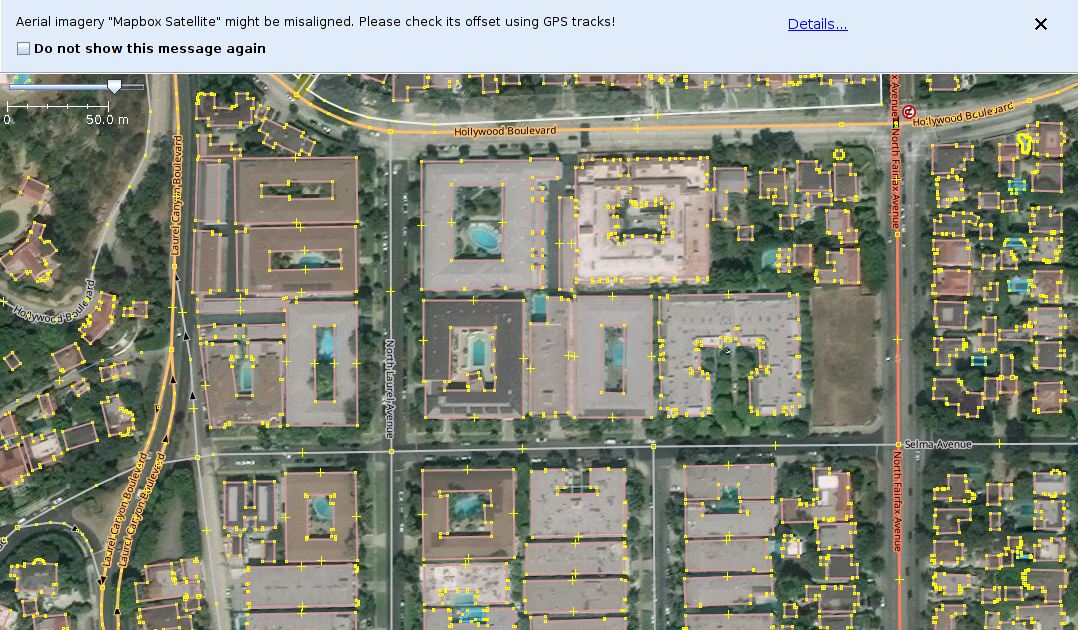
- Orthophotos Aerial imagery with the camera oriented straight-down is sometimes called the Bombardier’s View and is a typical method to create orthophotos. Tracing vector assets over orthophotos is common. Every one of the major imagery providers does have alignment issues in various local geographical areas. In the JOSM Openstreetmap editing environment, there are provisions for storing offsets, per local area, per imagery provider (e.g. MapBox Satellite versus BING in Central Europe). However, given current mapping feature density, it is possible for an OSM editor to simply copy the offsets of other features around them, somewhat analogous to driving a car in traffic at the same speed as the other cars, irregardless of the posted speed limit. Imagery alignment does matter and poor alignment can be the source of errors, but modern image analysis benefits from a crowd effect of multiple, stable reference sets in most all areas. These benefits are most quickly exploited by a human operator; using reference data to stabilize offsets in a machine learning environment is TBD.


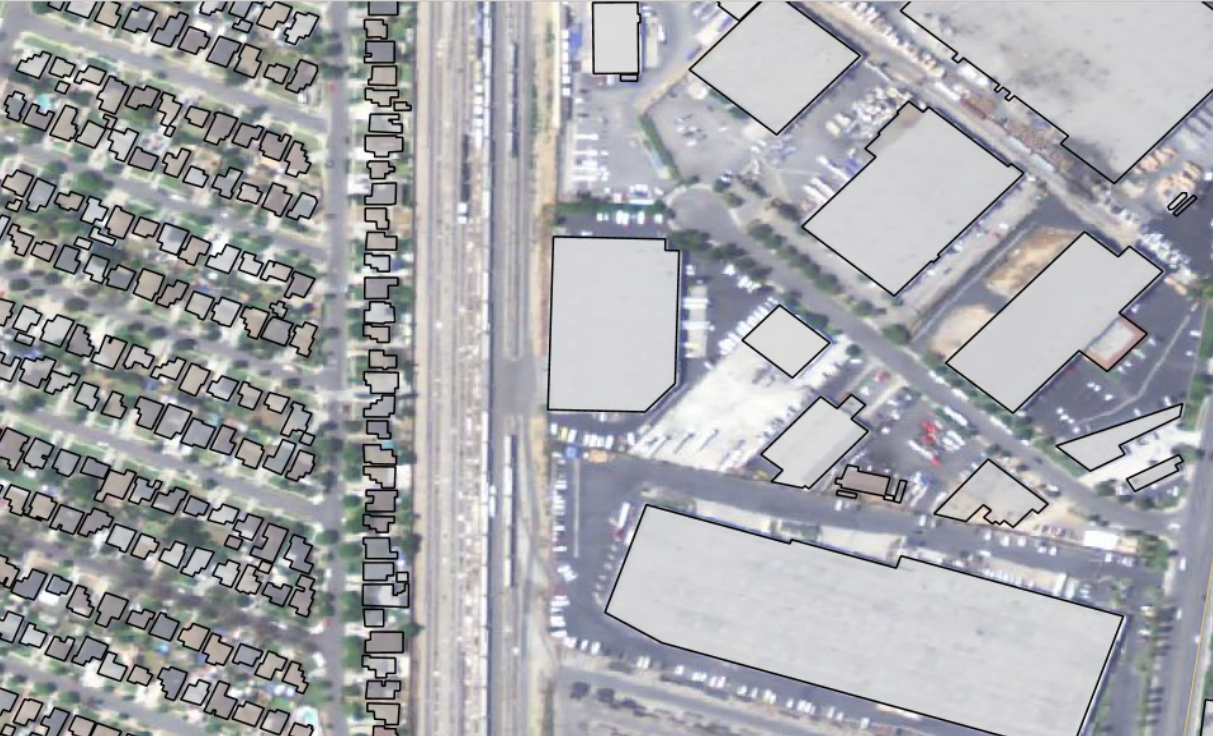
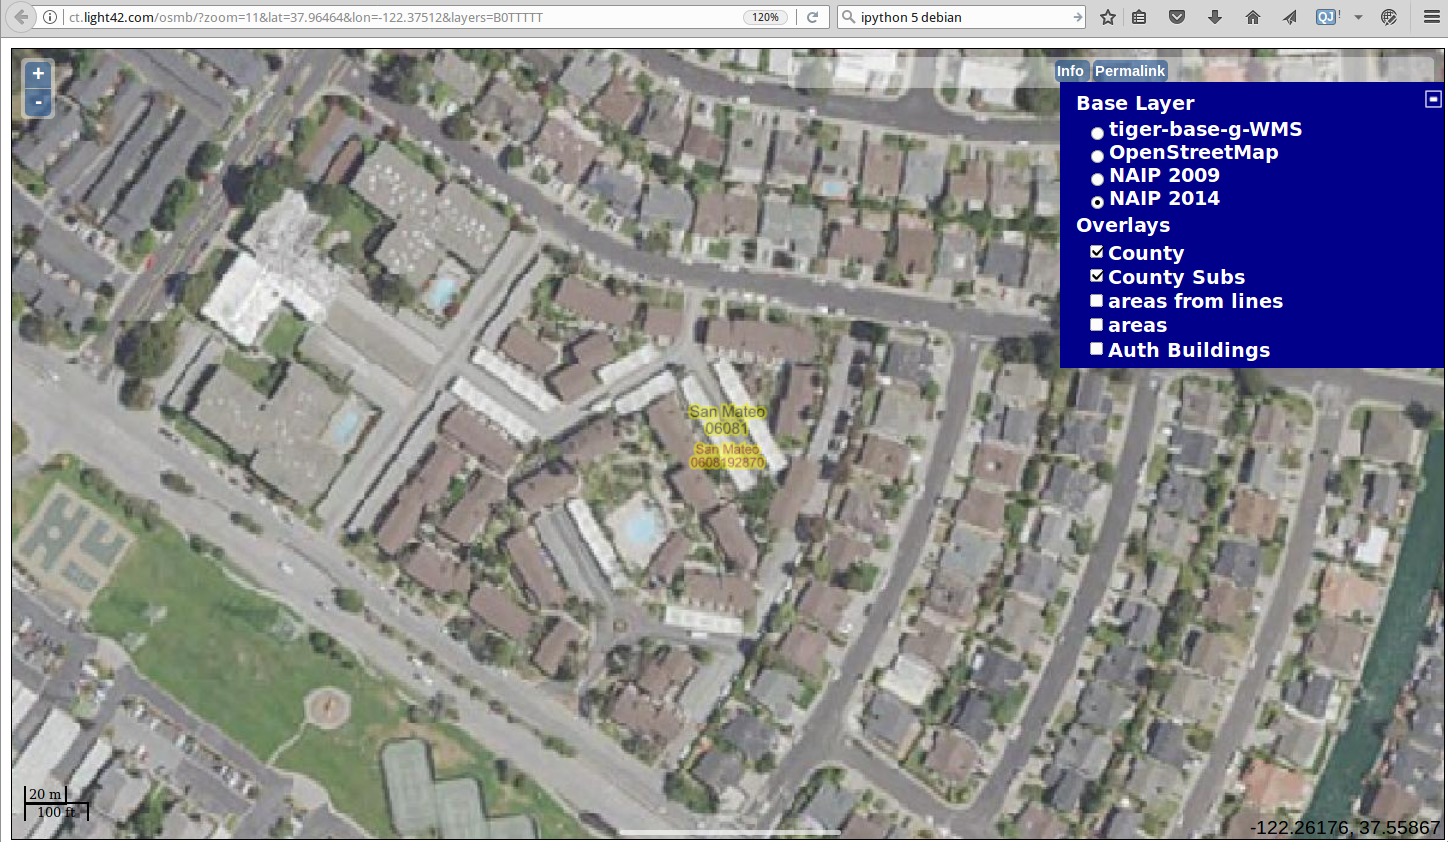
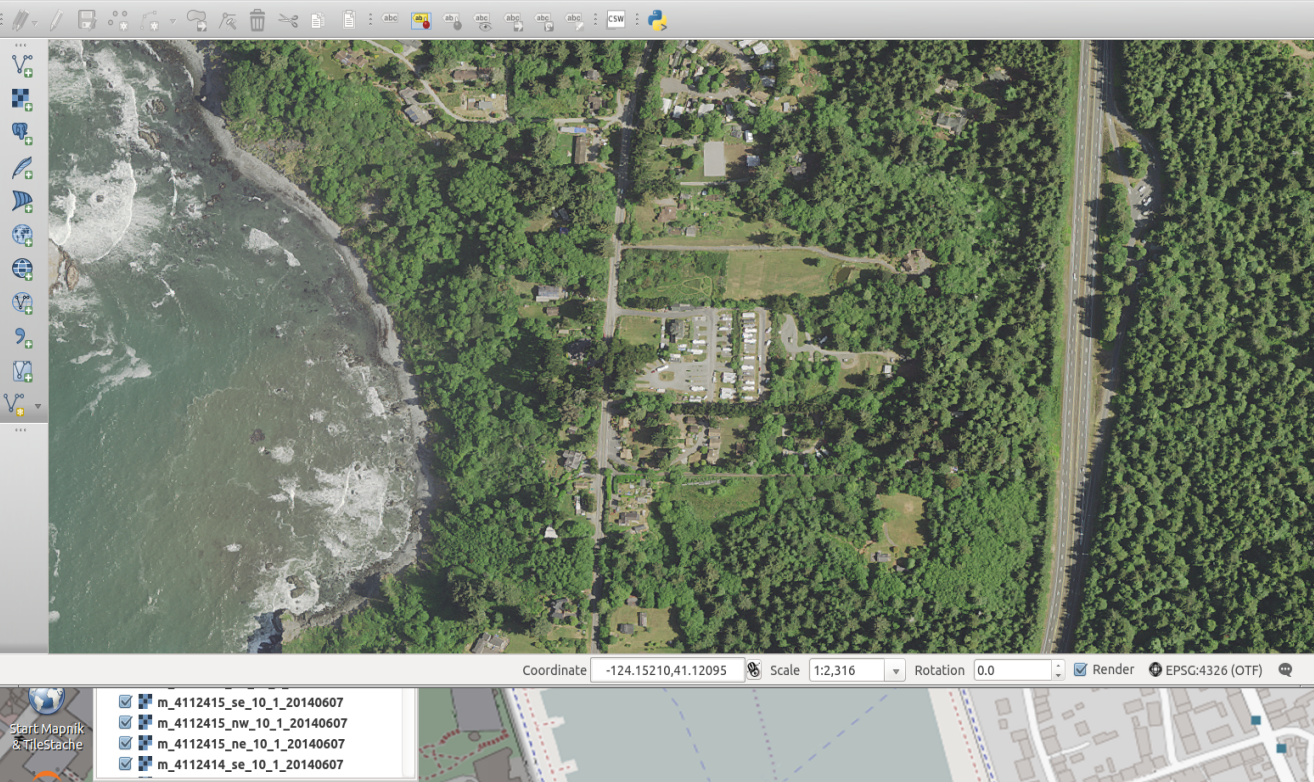
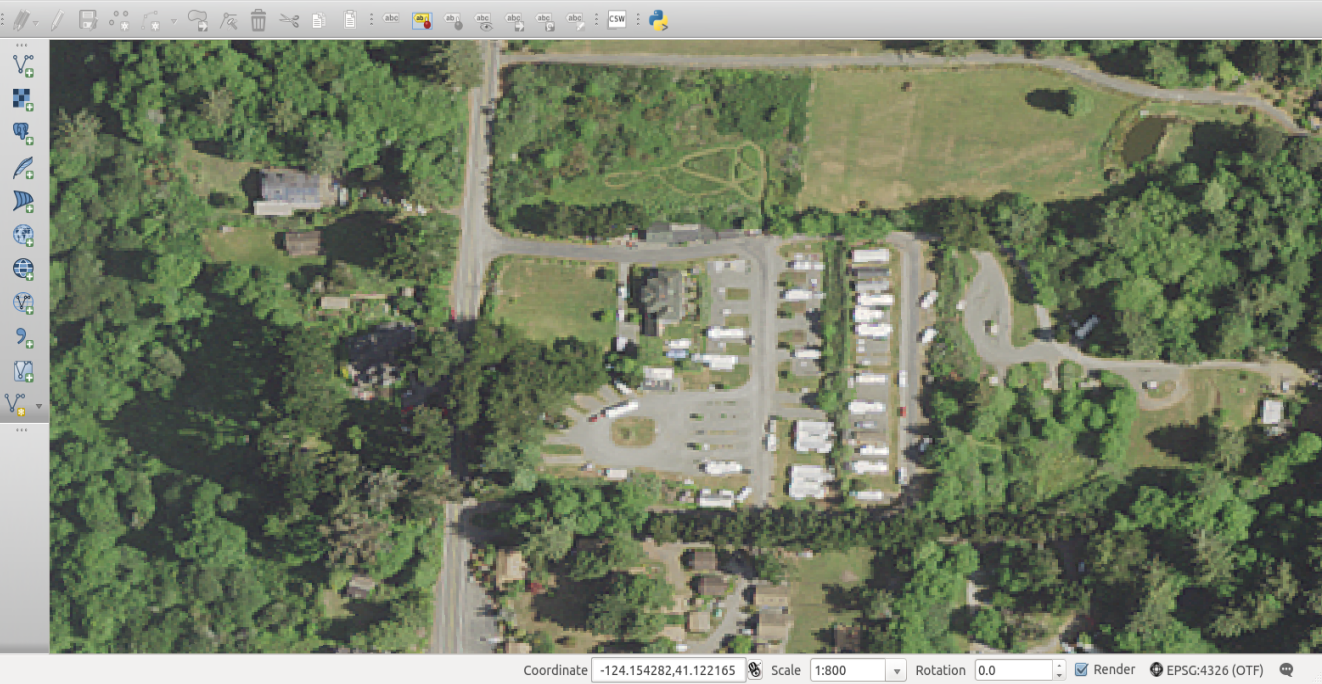
MapViewer osmb / NAIP 2014 Detail
NAIP 2016 Image Data for California
  example   Source Ortho Imagery Attributes
---------------------------------------------------------
Data axis to CRS axis mapping: 1,2
Origin = (577188.000000000000000,4150908.000000000000000)
Pixel Size = (0.600000000000000,-0.600000000000000)
Metadata:
    AREA_OR_POINT=Area
    TIFFTAG_IMAGEDESCRIPTION=OrthoVista
    TIFFTAG_RESOLUTIONUNIT=1 (unitless)
    TIFFTAG_SOFTWARE=Trimble Germany GmbH
    TIFFTAG_XRESOLUTION=1
    TIFFTAG_YRESOLUTION=1
Image Structure Metadata:
    INTERLEAVE=PIXEL
Corner Coordinates:
Upper Left  (  577188.000, 4150908.000) (122d 7'36.20"W, 37d30' 6.77"N)
Lower Left  (  577188.000, 4143612.000) (122d 7'38.95"W, 37d26'10.04"N)
Upper Right (  583086.000, 4150908.000) (122d 3'36.01"W, 37d30' 4.92"N)
Lower Right (  583086.000, 4143612.000) (122d 3'38.97"W, 37d26' 8.20"N)
Center      (  580137.000, 4147260.000) (122d 5'37.53"W, 37d28' 7.50"N)

  Band   1  Block=9830x1 Type=Byte, ColorInterp=Red
  Band   2  Block=9830x1 Type=Byte, ColorInterp=Green
  Band   3  Block=9830x1 Type=Byte, ColorInterp=Blue
  Band   4  Block=9830x1 Type=Byte, ColorInterp=Undefined
NAIP 2016 Image Processing Onsite @ MAPLABS Berkeley
## production run image processing scripts
##  re-sample, color model, compression to output format(s)
naip_fetch/catchup.sh
  /get_all_alameda.sh
  /get_all_ContraCosta.sh
    ...
  /get_all_Marin.sh
  /get_all_Monterey.sh
  /get_all_Napa.sh
  /get_all_Sonoma.sh
  /get_all_Sutter.sh
  /get_all_Ventura.sh
  /get_all_Yolo.sh
  /get_all_Yuba.sh

  /make_019.sh
  /make_029.sh
  /make_073.sh
  /make_kern.sh

  /make_ovrs_tif_spA.bash
  /make_ovrs_tif_spB.bash
  /make_ovrs_tif_spC.bash
  /make_ovrs_tif_spD.bash
  /make_ovrs_tif_spE.bash
  /make_ovrs_tif_spF.bash
  /make_ovrs_tif_spLA.bash
  /make_ovrs_tif_test.bash
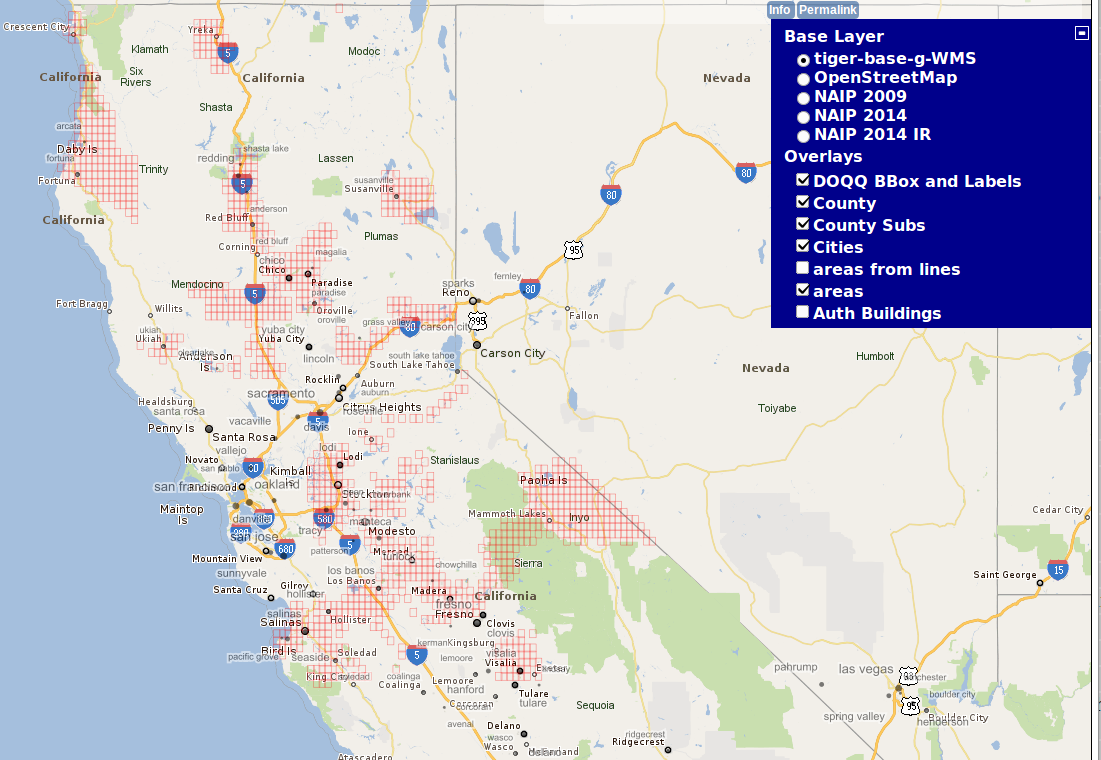
DOQQ coverage as of 13Feb17
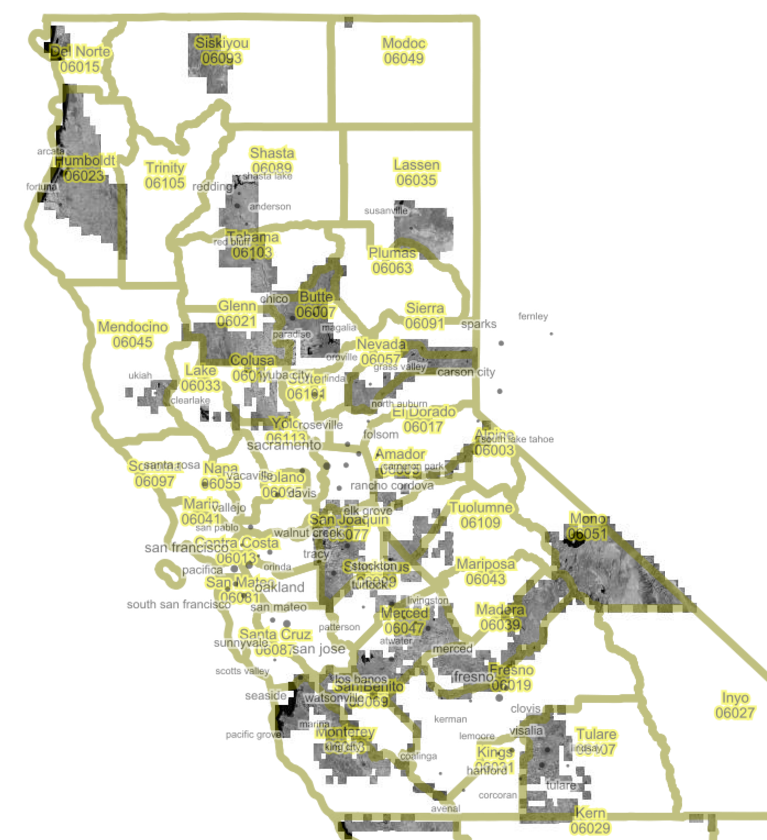
DOQQ Infrared (IR) areas processed as of 13Feb17
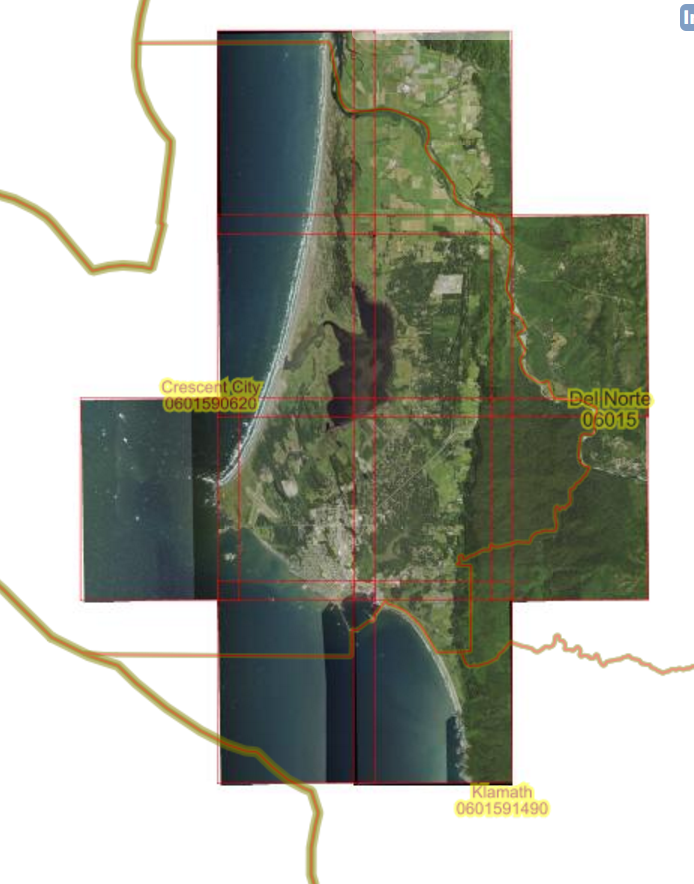
Calibrating the placement and overlap of DOQQs
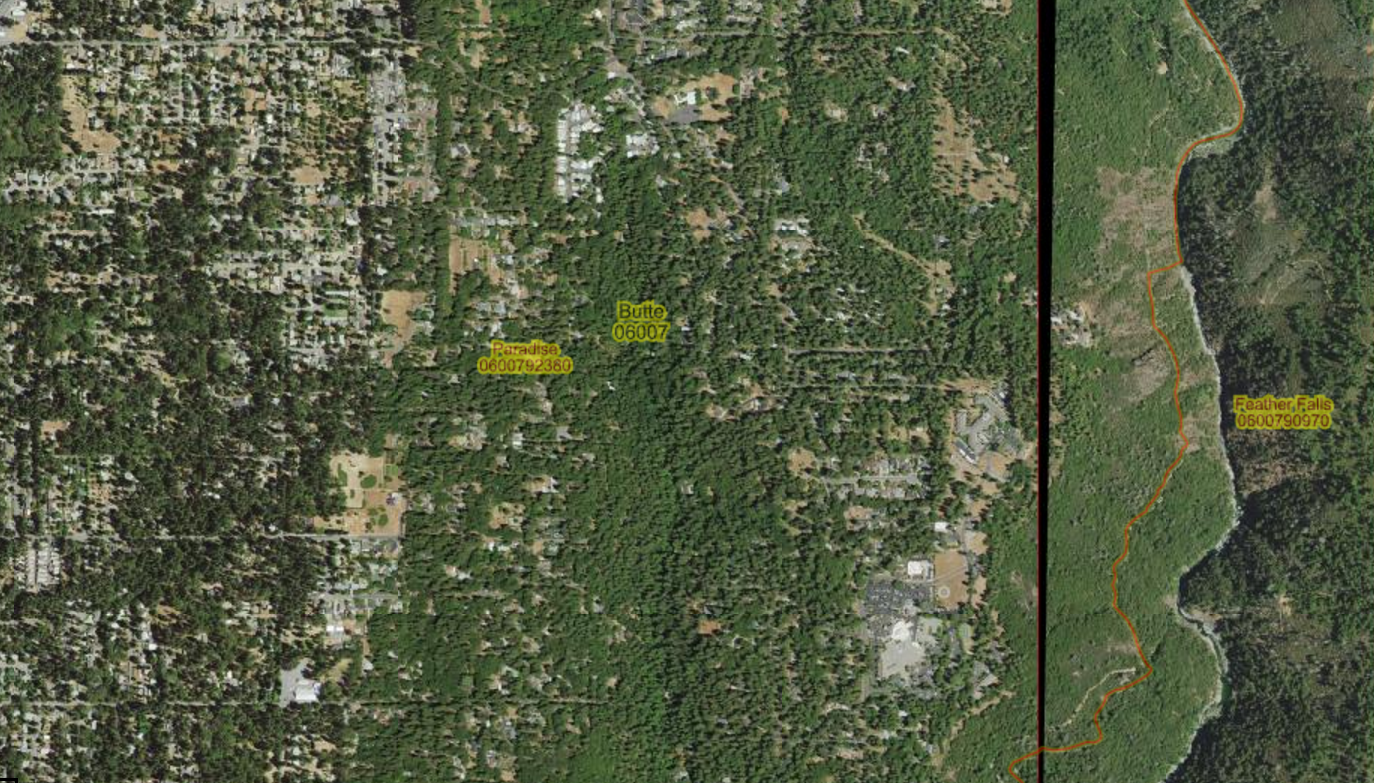
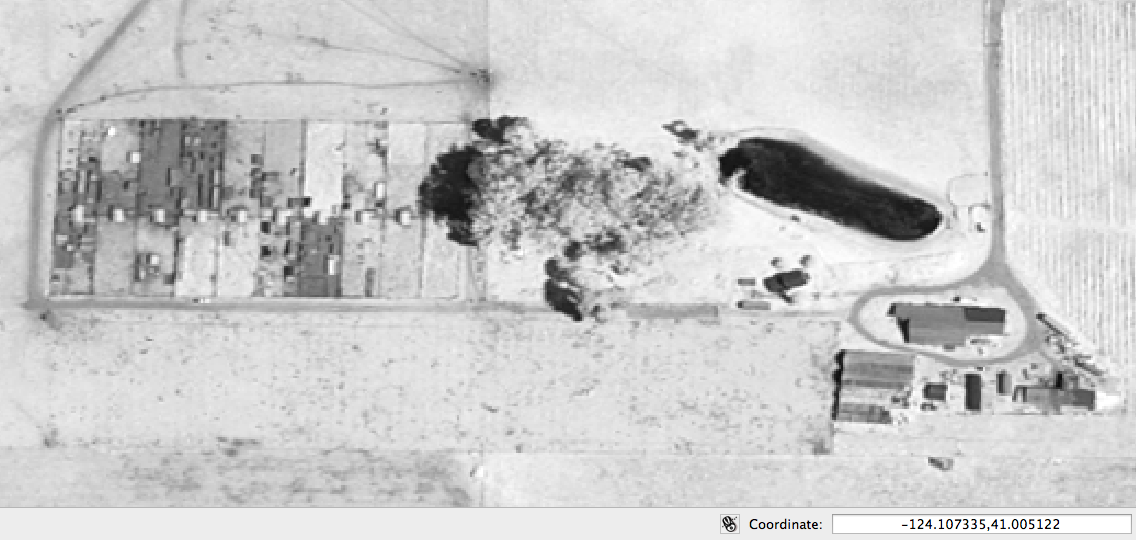
Masking Trouble in Paradise, California.
digital ortho quarter quad tiles (DOQQs) * Native Resolution
digital ortho quarter quad tiles (DOQQs) * 3x Resolution

digital ortho quarter quad tiles (DOQQs) * ex0
digital ortho quarter quad tiles (DOQQs) * Infrared Band

An Infrared (IR) View of Tree-filled Downtown Arcata, Calif.