![]()
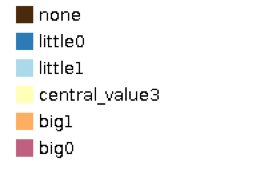
I am building some visualization layers in Geoserver from PostGIS, which requires .sld files (until Geoserver catches up with the CSS styling world – oh wait, look here). It is convenient to show ranges using ColorBrewer2 colors in a set of one plus five.. a color for NoValue, then what I call little0, little1, central value, big1, big0. People often use Standard Deviation for determining the color breaks, but StdDev is based on the average, not the median. In the data I am looking at, it makes a lot more sense to me to take the median value of all values that have a measure, or, a variation on that, all values with a measure and the measure is greater than zero.
In Postgres, I can use an extension called quantile.
a_grid_db=# SELECT

  quantile( pop_assoc_some_coll_pct, ARRAY[ 0.02,0.25,0.75,0.92])

FROM

  ag_edu_assoc_some_coll_pct

WHERE

  pop_assoc_some_coll_pct > 0 and

   pop_assoc_some_coll_pct is not null;
quantile
--------------------------------------------
{0.05866,0.14949,0.25696,0.32230}
In this example, I get approximately: little0 < 0.058; little1 < 0.15; central value > 0.15 and < 0.25; big1 > 0.25 and < 0.32; big0 > 0.32 (filled out completely with boundaries correct). Of course, there are specific reasons to use StdDev and a whole host of statistical techniques, in various situations. This basic technique is good enough for the situation at hand, and so, bears repeating.