demo on a standards-based browser “SeaMonkey”
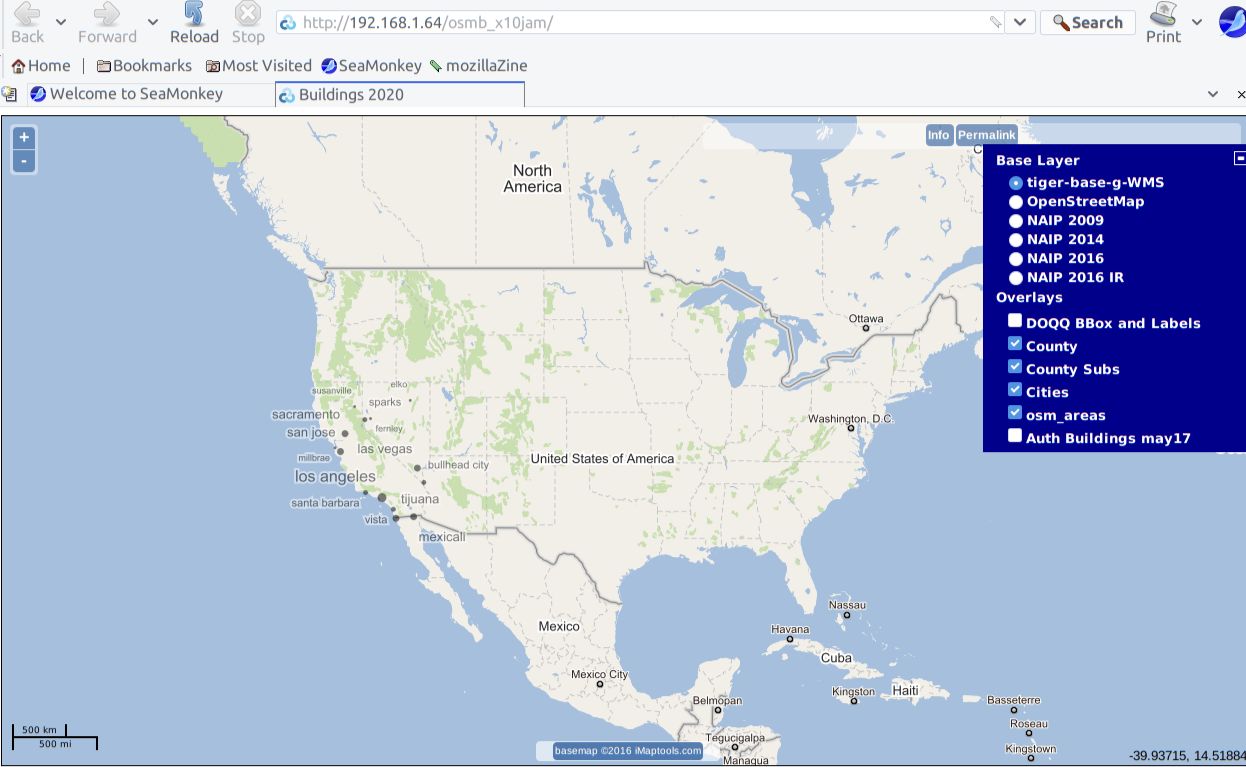
(click on the image for a larger view)
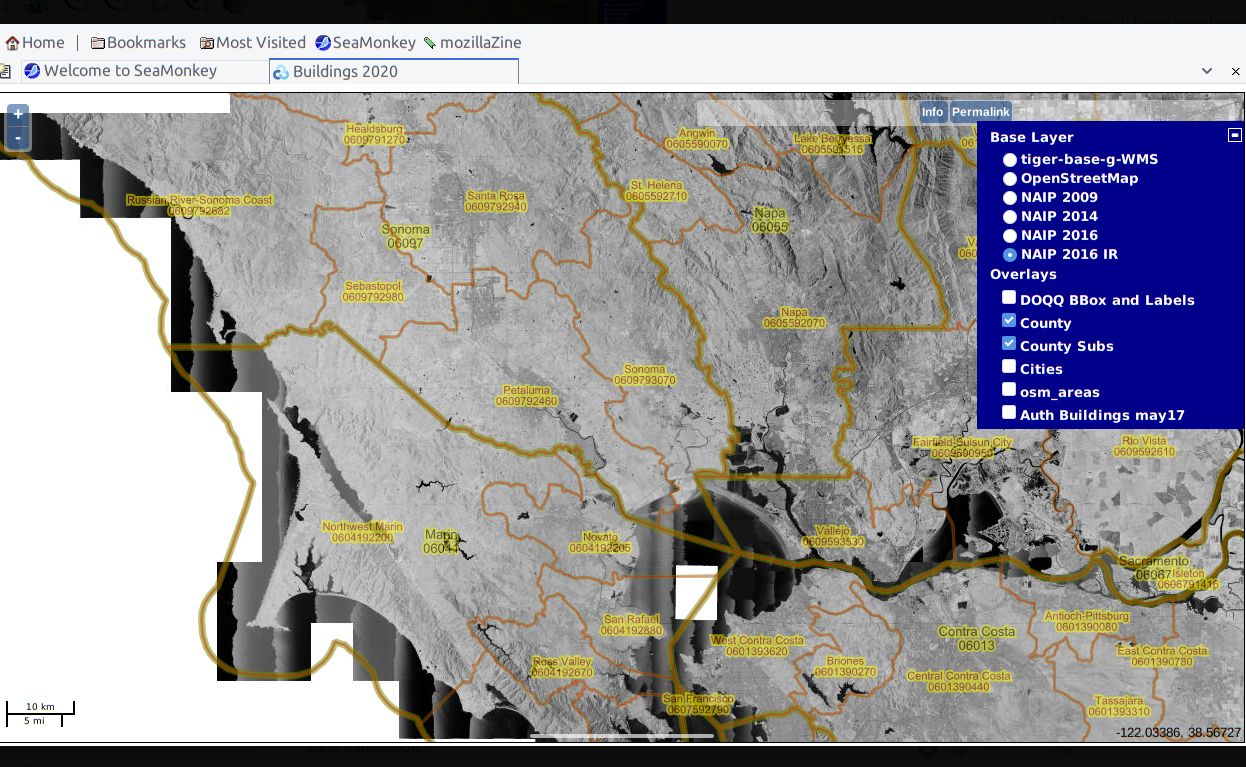
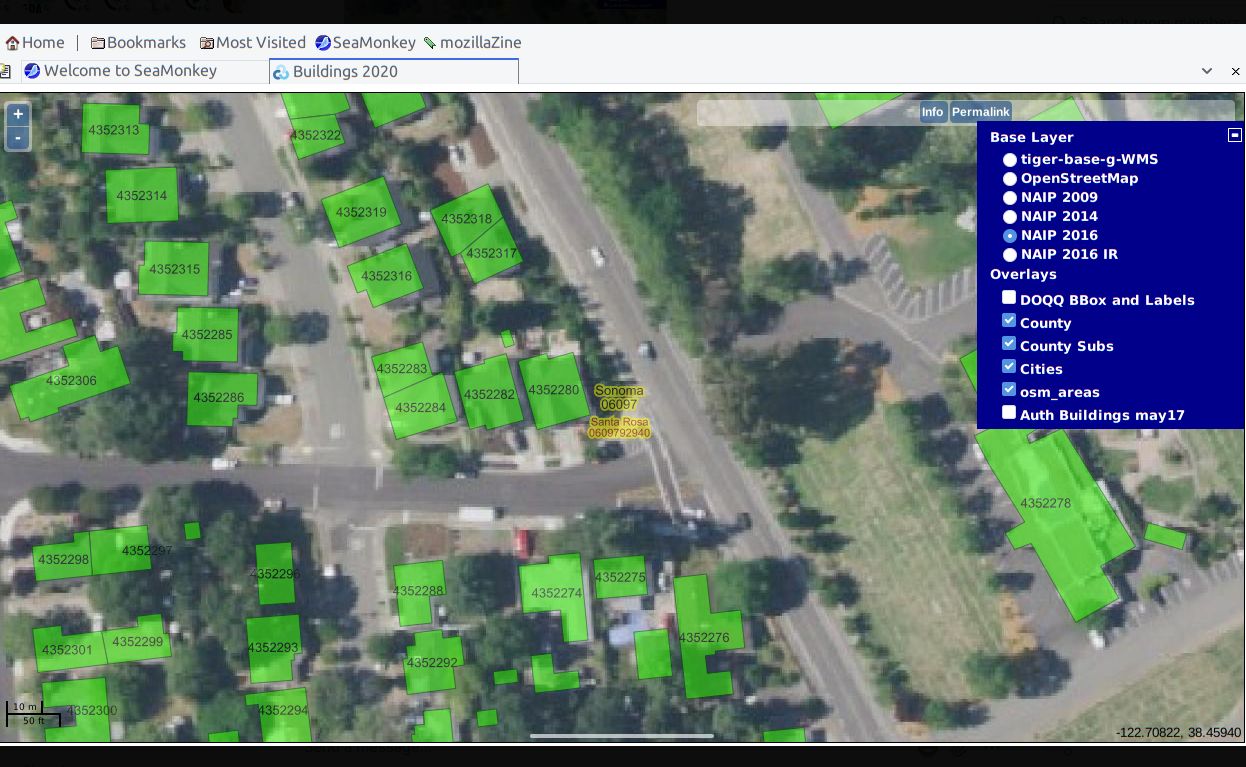
Obviously there is a label and some basemap.. Also notice that some California cities are labeled as POINT with varying size dots for population
The main concept is to show the inventory of 2D building footprints for California, compare to real ortho-imagery, and compare to other maps.. so I can zoom in to “Santa Rosa” city north of here, and see the buildings, and the satellite imagery for that area.. ( on a date before 1/3 of the city burned to the ground in 2017 )
Tour – I click the “zoom in” + sign twice
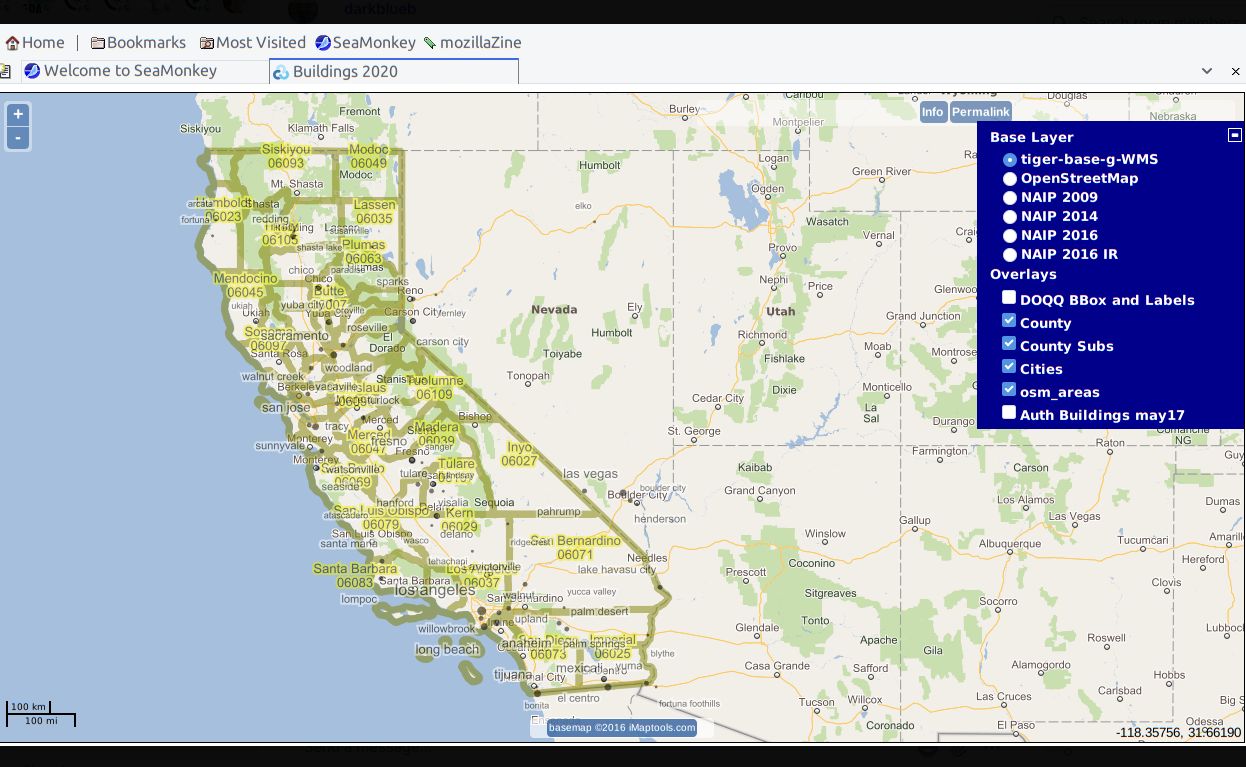
see the COUNTY boundaries with labels.
the COUNTY has a name, and also the five digit US Census code
( English at this time – of course it could be any language in the labels )
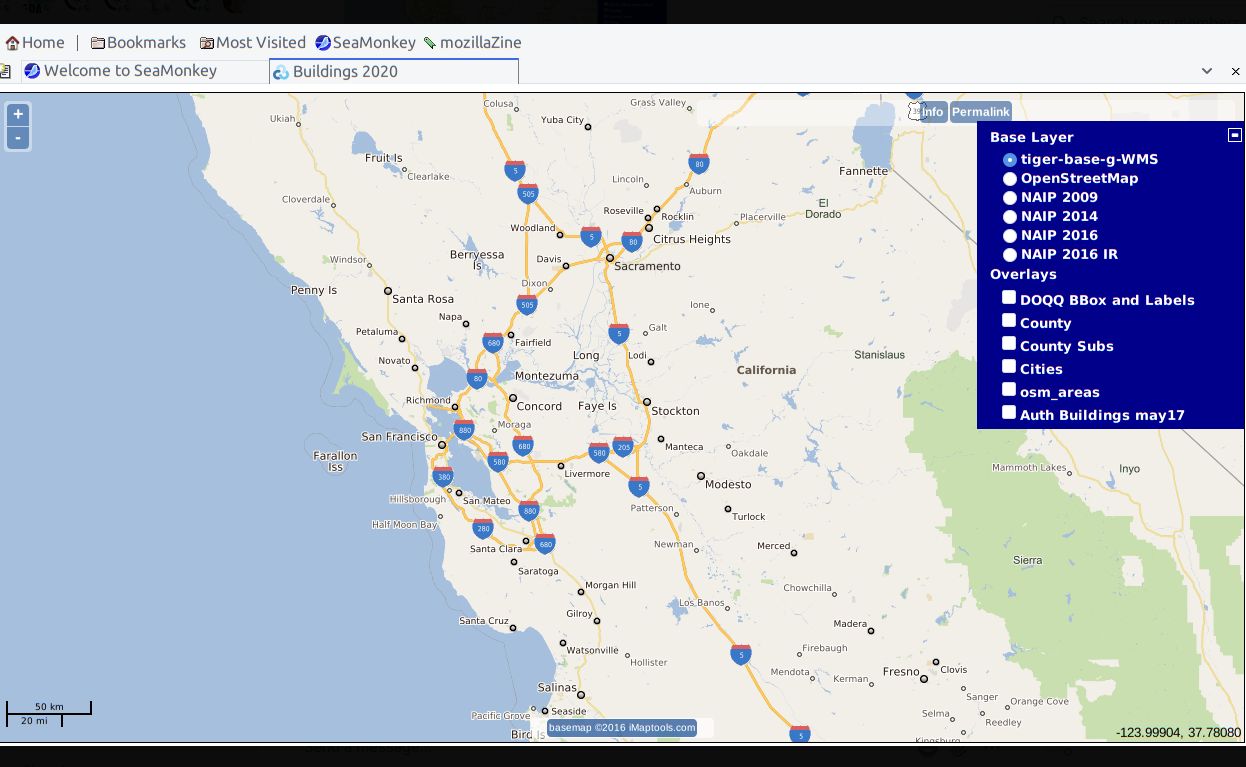
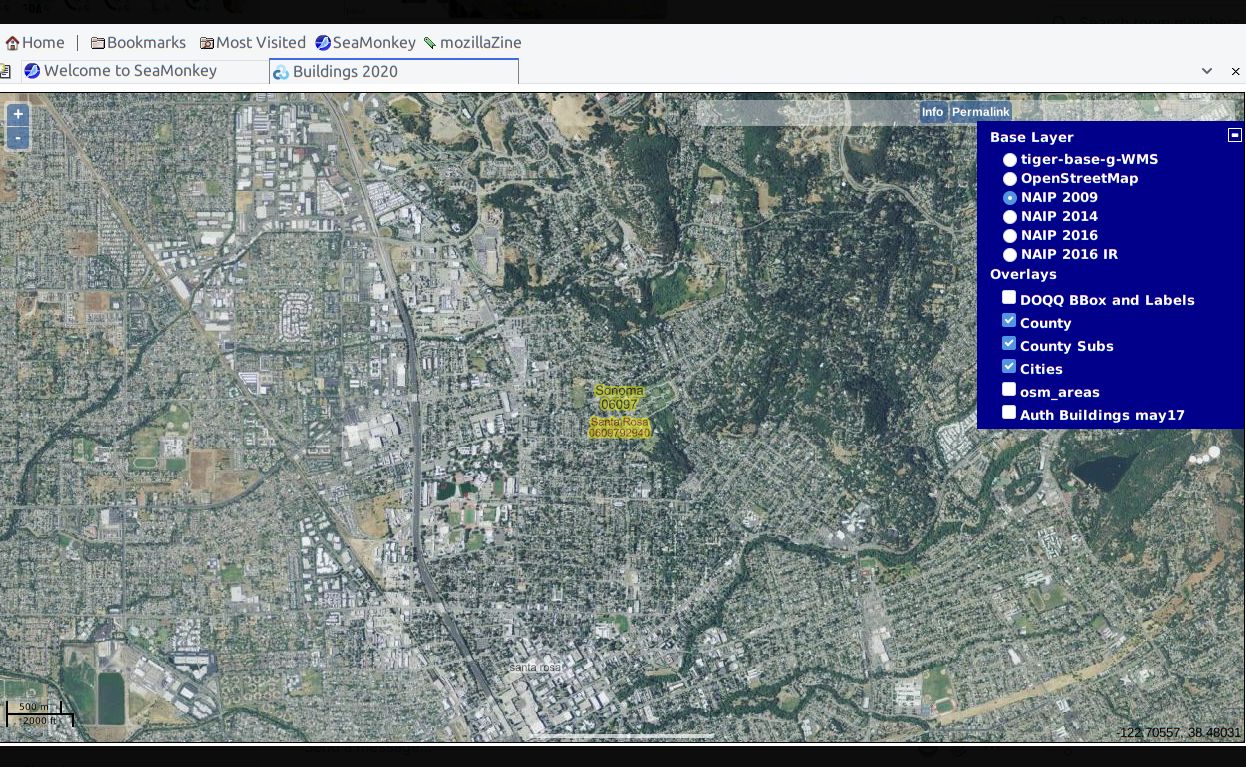
Tour Zoom in twice again, I see this.. the optional layers are OFF so this is only “WMS-Tiger” designed by swoodbridge it is implemented in Mapserver layers
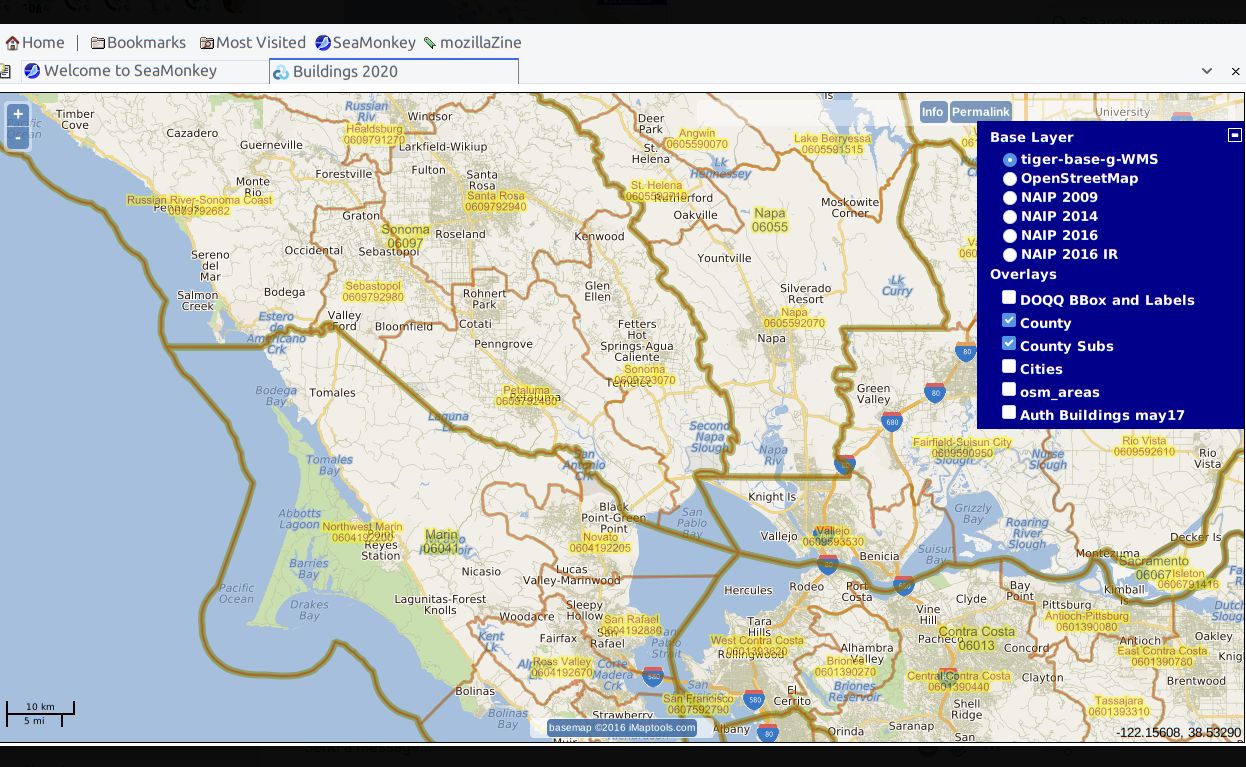
COUNTY and another layer COUNTYSUB , we are zooming into Santa Rosa, north of Berkeley. COUNTYSUB has formal definition.. so I can do summary statistics and share the results with other professionals. We can look at some other base layers at this level, also.. they work on all the zoom levels..
base layer 2016 has the high resolution ortho imagery.. 60cm per pixel 4-band
all local data — this is Santa Rosa in 2009
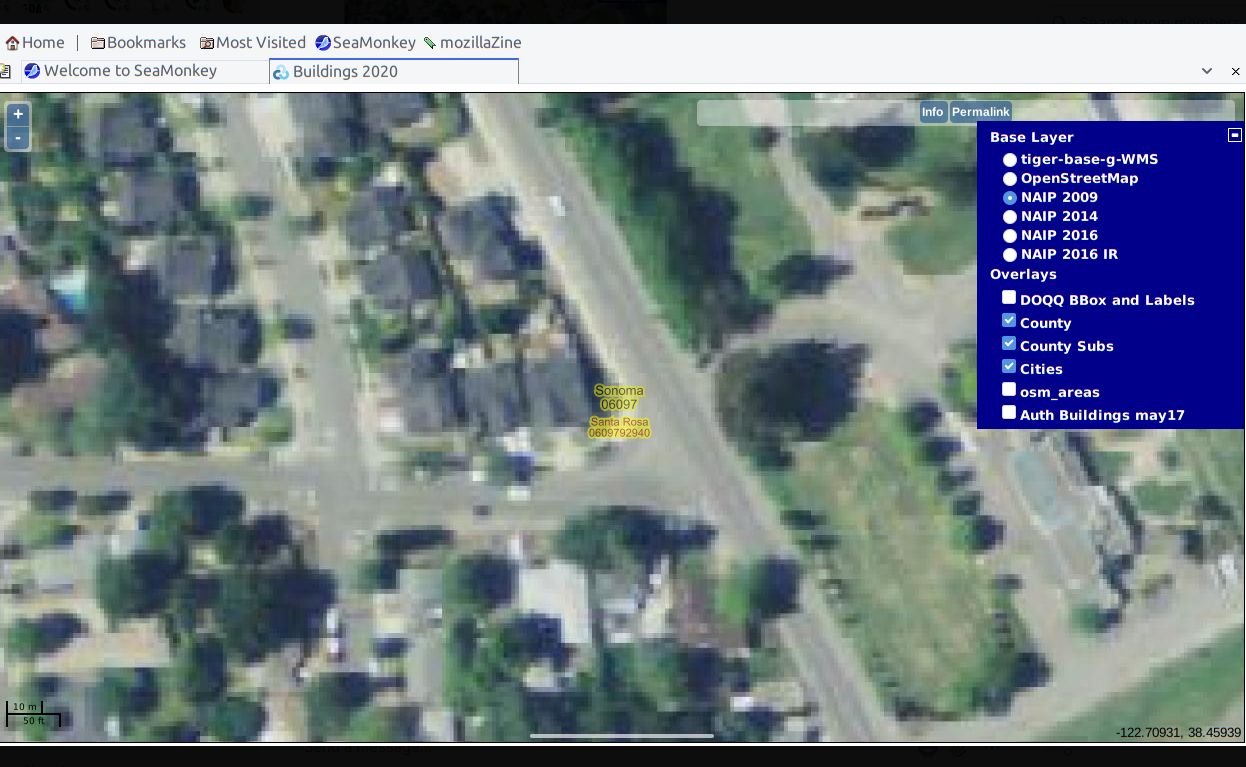
I dont have the AuthBldgs layer in all cities.. I will complete this tour with an area closer to me.. I do have data across the Whole USA, in California, and in many cities of California.. but in different amounts
( I have some Boston and Maine in the 2009 ortho-imagery, for example.. )
I want to say that #mapserver does layer caching and that is working here. Some updates when zooming are very, very slow
but in one view, clicking from a layer to another layer.. is instant — no delay, very very fast.. when the caches fill.
An ordinary user almost always does the move that is slow .. zoom out to a whole state or part of the USA, then zoom in fast.. the performance here for those big operations is very bad.. even on fast hardware.
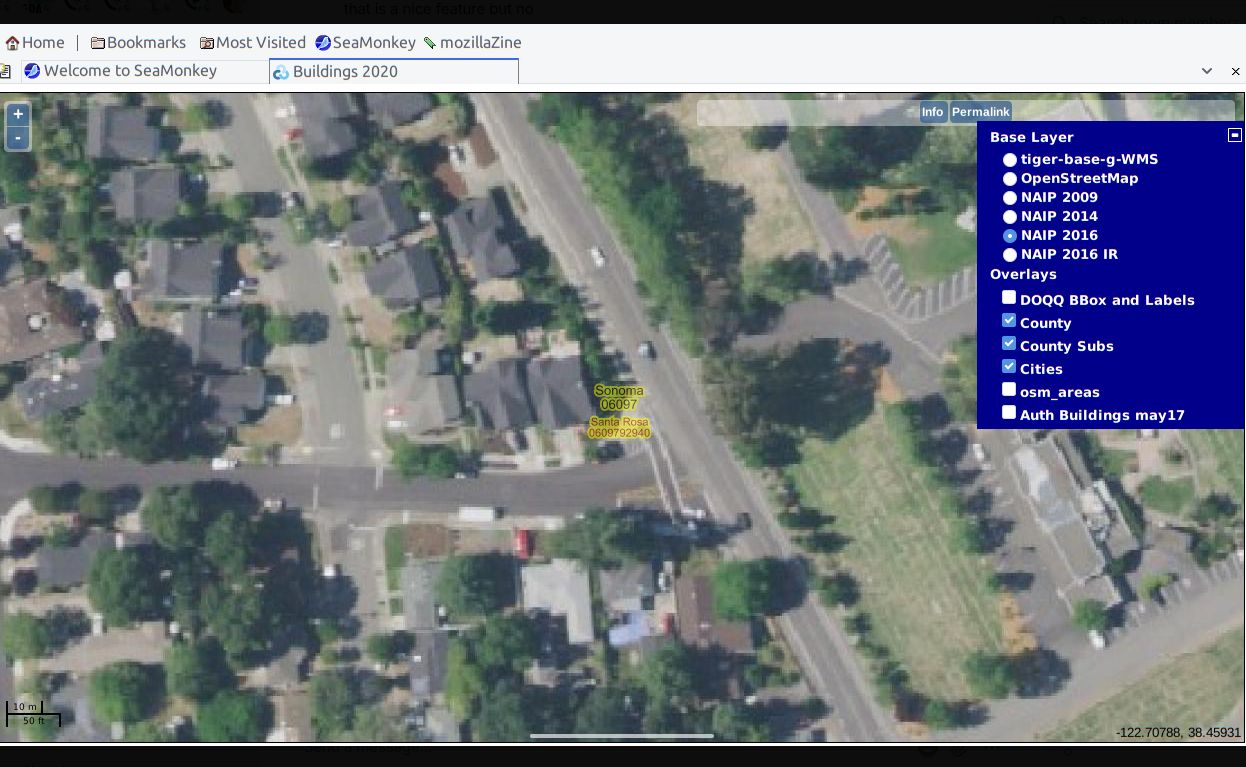
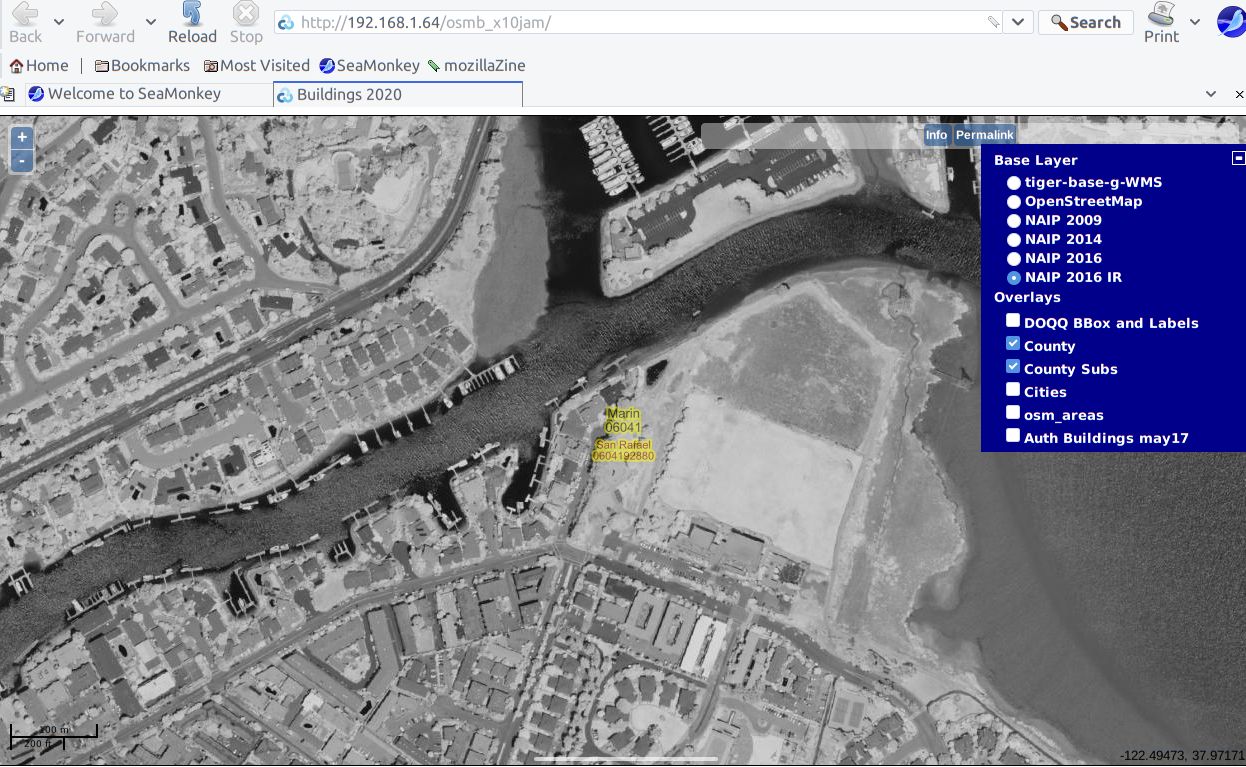
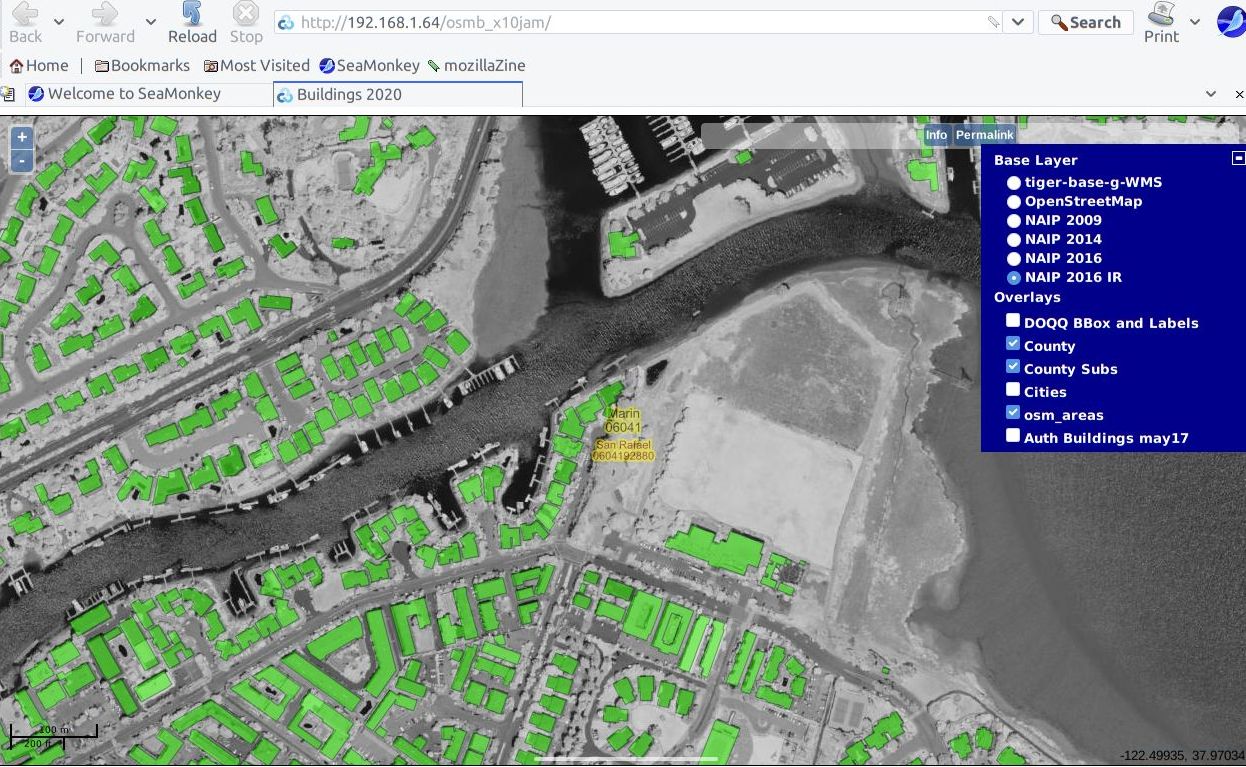
This is an area north of me, in Very High Resolution (VHR) 60cm per pixel Infrared
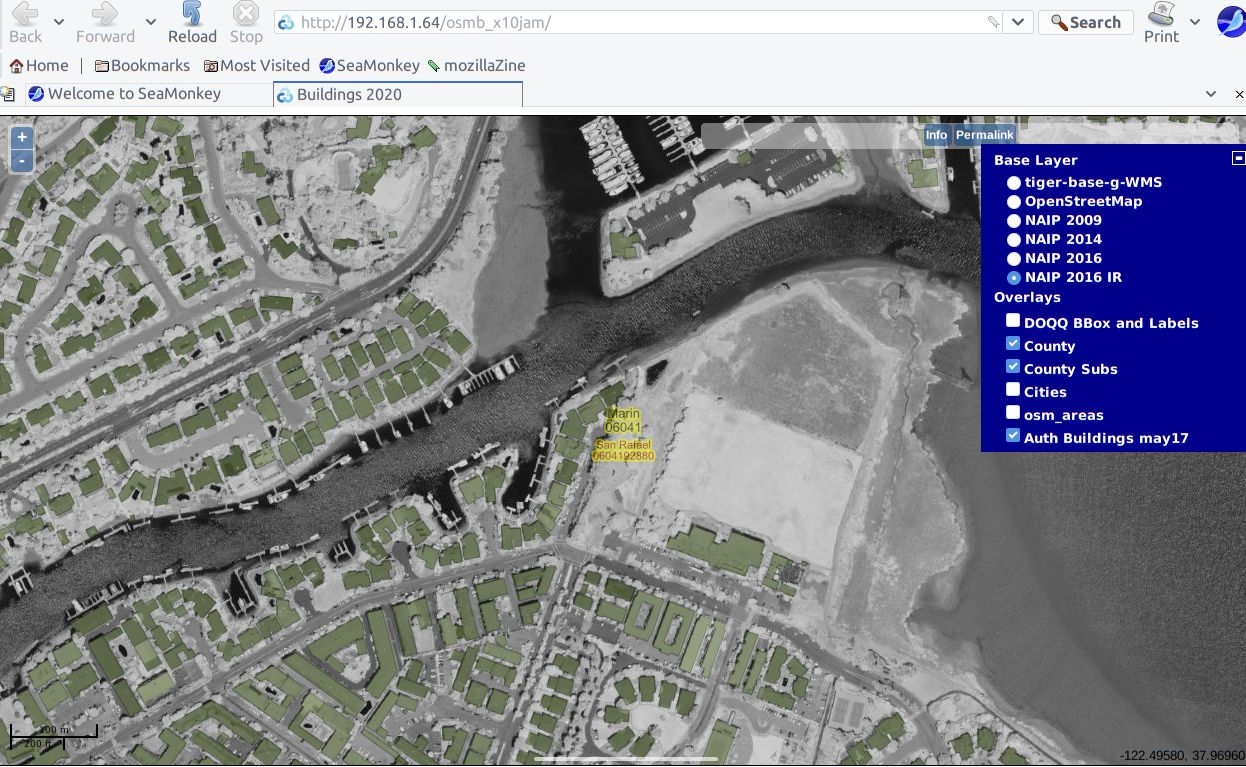
AuthData .. the project that paid for this
it took me years to learn all the parts, and months to build this data set.. there was a deliverable with many reports
It is certainly a “Masters Degree” worth of work, all together.. In my opinion.. but I have no Master’s Degree, and the technology stack is not very popular.. it is very ready for Machine Learning or other advanced analytics..
It is ready for 2020, 2024 or 2025 data.. using standards
this all runs on RedHat linux, also
the server is #postgis, #apache and #mapserver
there are postgresql tables with relational data on those 2D building footprints.. in some areas there is a LOT of data
on another day, we can look at a different project here.. from the library
questions? feedback ?
I think the TIFF data handling is one big topic; and the postgresql relational data is also a big topic; #mapserver definitions are a large topic, with #mapcache support.. the US Census data is also a large topic.. the installation on linux of all these parts, is a large topic
I think it is a month of classes, to talk about all of these parts
when I demo the map, the performance looks very slow
google maps and other web maps do a LOT of tricks to be fast
but, I have the DATA here.. I can add huge, huge amounts of detail data.. for research analytics