I set out to create a map that showed urban sprawl in the central valley of California.
Geoserver, OpenLayers and PostGIS are the technologies in this demo.
(the linux server itself is being relocated)
Introductory Overview
An overview of the central valley from a natural perspective, overlaid with two prominent marks of human development, highways and paved area. |
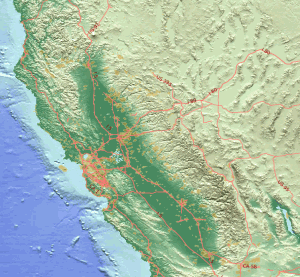 |
| Most all of the detailed information is organized by county – as the user zooms in, show the county names and boundaries in order to facilitate choosing an area of interest quickly. |
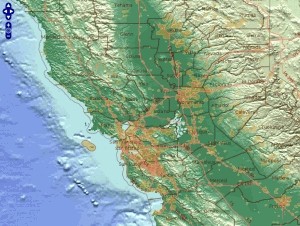 |
| The low resolution base relief is soon to be discarded, while the names from US Census 2010 county subdivisions now appear. |
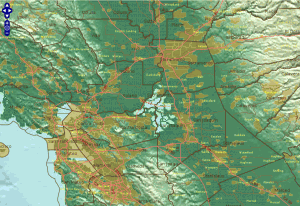 |
| Two methods of quantitatively determining where urban boundaries lie are visible, with a base layer of greenfield classification. |
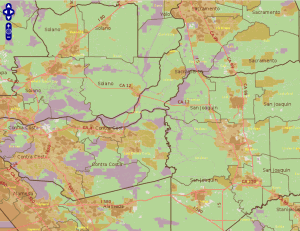 |
| At the next zoom level, OpenStreetMap place names add minimal point-of-interest context, the county subdivision names are gone, while the emphasis stays on area classification. |
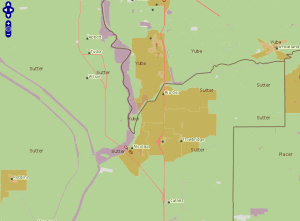 |
| Various classification layers are available – shown here is a California Farmland Monitoring layer. |
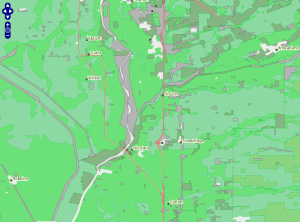 |
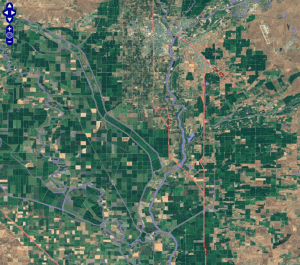
| California NAIP 2010 imagery of farmland outside Yuba City, the bright pink major highways layer, and a reasonably accurate water layer shown. |
 |
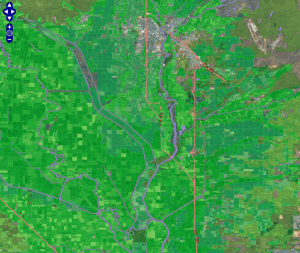
| Classification layers can be combined with a base layer, for example imagery. |
 |