As a way to learn about the geo constructs in the U.S. Census data, I built a few visualizations of the area where I live.
Elementary Constructs
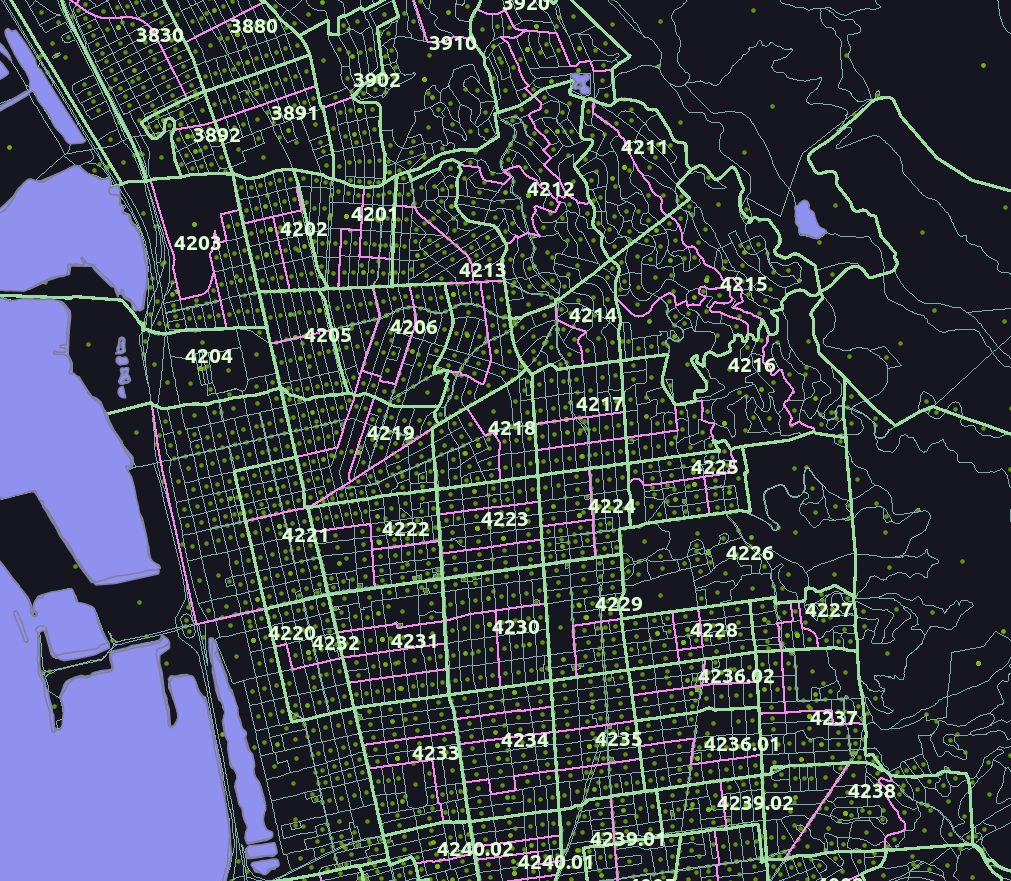
The heavy green lines are census tracts, with their tracts ID shown in large. The pink lines are census block groups. Census blocks are shown, along with the centroid of each. This data comes directly from PostGIS and is styled in QGis

This next image shows the San Francisco Bay Area, Napa Valley to the north, the greater metropolitan area of the state’s capital Sacramento to the southern tip of Lake Tahoe, a portion of the Central Valley down to a corner of Yosemite National Park, then back across Silicon Valley to the Pacific Coast. Each county is divided into census county subdivisions, with its name in yellow. Census place is shown as orange. The heavy pink lines are major highways from OpenStreetMap. Images are served via GeoServer and SLD Styles and again displayed in QGis.
Census data is not the same set as TIGER (Topologically Integrated Geographic Encoding and Referencing) data, but the two are directly matchable via embedded key fields. see the TIGER documentation
Here is the backwards wording from TGRSHP2013_TechDoc, that says that blocks are the indivisible component of all census geometries:
Blocks never cross county or census tract boundaries. They do not cross the boundaries of any entity for which the Census Bureau tabulates data, including American Indian, Alaska Native, and Native Hawaiian areas, congressional districts, county subdivisions, places, state legislative districts, urbanized areas, urban clusters, school districts, voting districts, or ZIP Code Tabulation Areas (ZCTAs) or some special administrative areas such as military installations, and national parks and monuments.