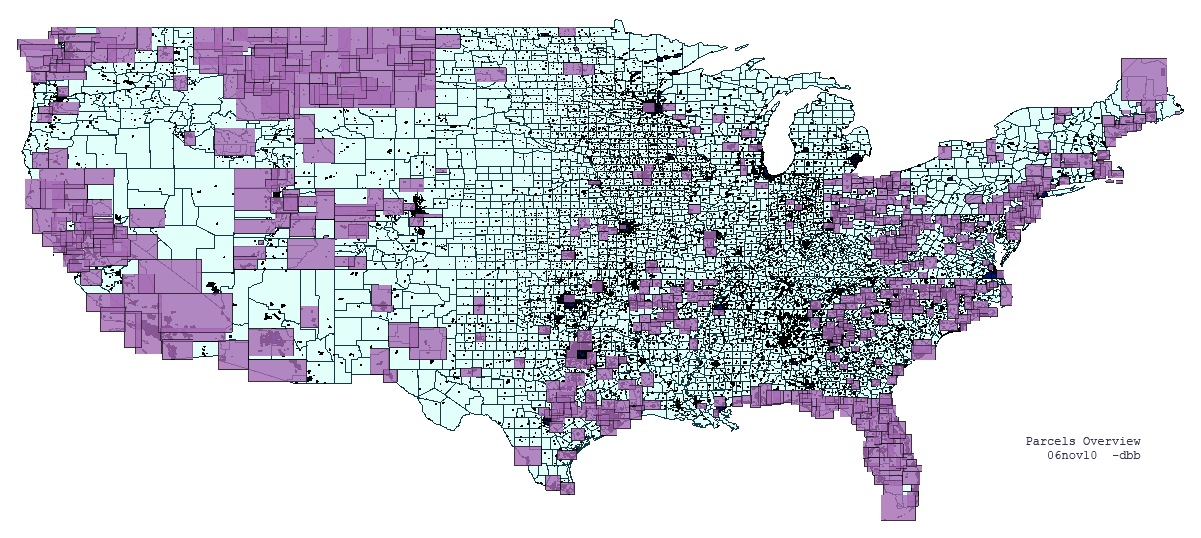
Two years ago a hard disk arrived on the desk of a colleague, from persons claiming to have some kind of parcel data “for every state in the US.” Naturally, being very skeptical and at the same time, just a bit eager to show off open source tools on linux, I whipped up a script to make this visualization — the result was many gigabytes of shapefiles represented by one 135K png.
What was the difference between loading potentially half of North America as parcels into a database, or simply gathering what is needed and moving on without loading anything?
=> recursively find each shapefile; use ogrinfo to get just the shapefile layer’s BBOX; use a regular expression to emit an INSERT statement into a spatial postgis table defined for this purpose; use psycopg2 to execute each INSERT, periodically COMMIT; COMMIT again at the end of the loop.
On completion you have a table of BBOX, one for each shapefile layer. For the visualization, I used QGis. All shapefile BBOX’s are displayed with transparency to show the density and the metro areas background.
Even given the excess inherent in using its BBOX to represent each shapefile, the graphic easily showed that the collection of data was not exactly as it was described.