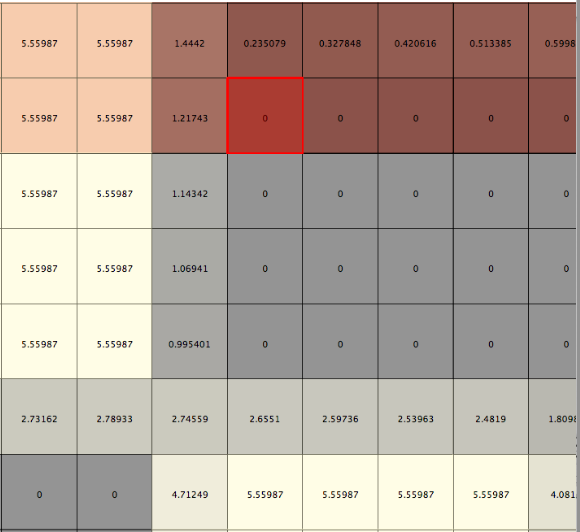
This visualization shows two quantitative dimensions at once, on a 150 meter square grid in a study area in California. The base color is a category of land use, and the gray shading is a percentage of developable acreage. The number on each grid cell, drawn using QGis, is synonymous with the gray shade.