A systematic way to choose, extract and visualize data from the massive American Community Survey 5 Year census product is a challenge. I have written python code to ingest raw inputs into tables, and a small relational engine to handle the verbose naming.
An extraction and visualization process is underway… something like the following:
0) bulk tables in all geographies for all states
1a) define a batch of tables to extract by table_id
1b) choose a state or territory
1c) choose a geographic summary level
for example:
STATE  California (FIPS 06)
TABLE  ('B01001', 'SEX BY AGE', 'Age-Sex', 'Universe:  Total population')
  GEO  Tracts (Summary level 140 - State-County-Census Tract)
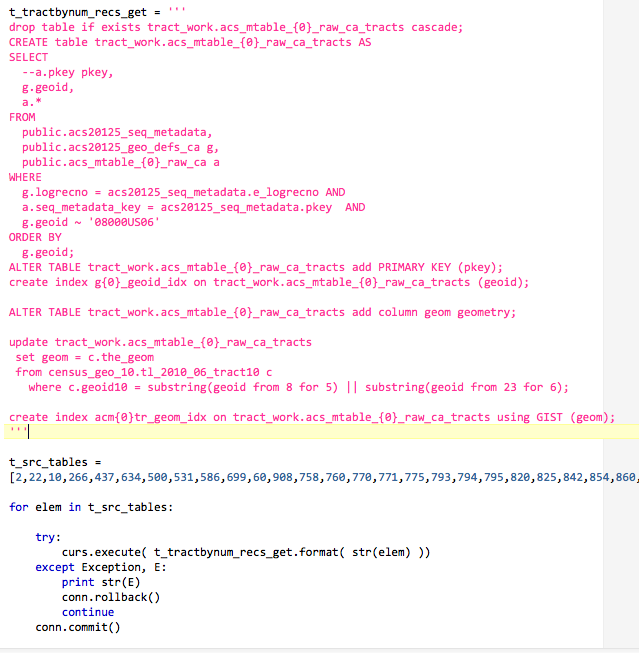
Once the choice is made, SQL + Python is executed, either as a standalone program in Linux or in the IPython Notebook. The code creates a working schema in PostgreSQL, copies table subsets into the new schema, and JOINs them with TIGER geometry to get spatial data. A preliminary, working version looks something like this:
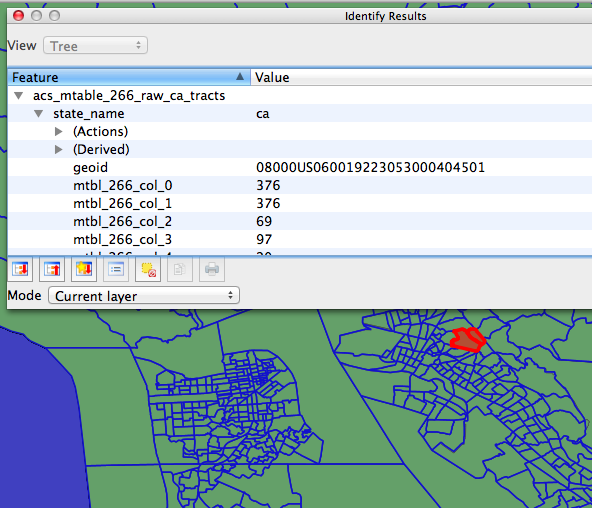
graphical browsing of the results in QGis:
geographic summaries defined in ACS_2008-2012_SF_Tech_Doc:
Appendix F: ACS 5-year Summary Levels/Components for Detailed Tables